There was an article in the New York Times about American Science and Engineering today. It said that the ASEI SmartCheck is being tested in airports. This device takes a full-body, low-energy x-ray scan. The image generated allows security personnel to see through clothing, but not inside the body. If nothing else, this has to be great visibility for the company.
Friday, February 23, 2007

Tuesday, February 20, 2007
Goodbye, PW Eagle...
...hello, Optimal Group.
I went ahead and sold PWEI, and replaced them with OPMR. It was nice to find OPMR on the MFI list; I first became aware of OPMR in a recent Motley Fool write-up. MF essentially said that OPMR is risky, because it's in a beaten-down industry, online gaming. OPMR also has an electronic wallet division. The MF write-up convinced me that OPMR is cheap, I mean, really cheap - cheaper than the 12% EY listed on the MFI list suggests. Essentially the e-wallet division is free, and it acounts for 1/3 of the company's business. Moreover, if the company grows at anything like historical growth, it should be worth quite a bit more than it is being sold for currently: the share price seems to imply only 7% growth. So, as they said, cheap is cheap. And that was why I bought into OPMR.
I went ahead and sold PWEI, and replaced them with OPMR. It was nice to find OPMR on the MFI list; I first became aware of OPMR in a recent Motley Fool write-up. MF essentially said that OPMR is risky, because it's in a beaten-down industry, online gaming. OPMR also has an electronic wallet division. The MF write-up convinced me that OPMR is cheap, I mean, really cheap - cheaper than the 12% EY listed on the MFI list suggests. Essentially the e-wallet division is free, and it acounts for 1/3 of the company's business. Moreover, if the company grows at anything like historical growth, it should be worth quite a bit more than it is being sold for currently: the share price seems to imply only 7% growth. So, as they said, cheap is cheap. And that was why I bought into OPMR.
Monday, February 19, 2007
MFI vs. Wilshire 5000
I'm having trouble deciding whether MFI is really winning - I suspect it is, but I'm trying to figure out by how much. My MFI portfolio is up 13.43% total, compared to the Wilshire 5000 that's up 14.78% over the same period - since I started my portfolio. But my portfolio is affected by having three separate buy periods. So is it by averaging the returns since the three buy periods? In this case, it's 16.2%, compared with the average change in Wilshire 5000 of 10.67%. The IRR of my MFI portfolio is 37.0%. I think that's probably the key; and in this case, it would be compared to the IRR of the Wilshire, which is 25.1%. So, yes, MFI is winning.
The real problem is my latter two sets of stock picks - they've stunk. The first set returned 38.58%, compared to 15% of the Wilshire; the second returned 8.92%, compared to 13.4% of the Wilshire, and finally, 1.1% from MFI compared to 3.6% of the Wilshire. What did I do right in the first set of picks that I didn't do in the second and third picks? Or more likely, what did I do wrong in my later picks that I didn't do in my first picks?
Friday, February 16, 2007
The *one* buyout that wasn't profitable...
A little while back, it was announced that PWEI was being bought out by their rivals, J-M Manufacturing, for $33.50 per share. A number of MFI stocks have been bought out, IVII, KOSP, PLAY, KMG, for example, but others as well, and generally at healthy premiums. I actually bought PWEI at $34.11, so as one might imagine, I've been a little annoyed. The general consensus seems to be to sell, and, although I've been holding off, I think that is what I'm going to do.
At this point it's an arbitrage play, with very defined values. Current price hovers in the $33 - $33.10 range, so there's little upside. In fact, because the values are so well-defined, I can calculate my upside. Today's close was $33.10. So there's $0.40 upside, or about 1.2%. The deal is expected to close sometim in Q2. That's somewhere between 1 and 4 months from now; let's say an average of 2.5 months from now. That gives an average of 0.48% per month, or 5.8% annualized.
MFI is typically expected to best the market, and this is worse than the expected average returns of the market. Clearly, there's better potential by investing the money somewhere else. I'm going to do it - I'm just sorry I didn't do it sooner.
My own annoyance aside, I'm a little surprised that PWEI convinced Pirate Capital, the private equity firm that had been buying stock like crazy over the last little while, to vote in favor of the merger. Pirate will break even or lose money on all of the shares they bought from Oct. 13 to Jan. 8. Sure, a number of their earliest purchases were in the mid-twenties, but still, a lot of their purchases are in the low-to-mid-thirties. Now they're still buying shares, doing the arbitrage for the 6% annualized return, which I guess is a little better than 5% in a savings account, but still--!! I'm not sure whether there's something I'm not seeing, that's all.
Wednesday, February 07, 2007
Monster
Big day today. My portfolio was up 2.2%. The big movers driving this were:
ALNY, 6.75%
ARNA, 3.9%
ASPV, 8.5%
CBST, 4%
EDU, 9.5%
GIGM, 7.1%
OYOG, 10.8%
SCSS, 5%
TRLG, 7.3%
VPHM, 3.6%
(including some after-hours trading)
It's a pretty mixed bag, too. Some had earnings reports, some had no news at all. GIGM and EDU both tap the Chinese market - maybe somethin was going on there? But - no big move out of CTRP, after last weeks cashing-in, maybe it would be out o whack with the rest of the region. ALNY had good news, but VPHM, CBST and ARNA had none, so maybe there was a biotech thing - but one that skipped MEDX and NOVC. TRLG had no news, but has been climbing pretty steadily. Maybe this is the short squeeze that Marshall predicted?
In other news, I've been climbing in the ranks over at the Motley Fool CAPS stock picking game. Players pick stocks to outperform or underperform the market. Players are ranked based on total difference from market performance (better than the market for outperform calls, worse than the market for underperform calls) as well as on accuracy - fraction of calls in the right direction. I've had some major swings, but I'm now in the 97th %ile, ranked 472 out of 21890 players. My accuracy is over 60%. Of course, I mention all that with the caveat that the game has been going on for too short a period to say anything that is statistically meaningful. Search for me as 'jamiemb.'
Saturday, February 03, 2007
Evaluating management
Just in time for my last post, this discussion came up on the MF discussion boards. It's really very rare that I read them, so it was a pretty happy coincidence that this was posted just the other day by TMFCanuck at http://boards.fool.com/Message.asp?mid=25115298
We all know that good management is critical to a companies success. How can an individual investor value management?
Currently I rely on what I can find in the TMF Boards, Newsletters, and searches of the WSJ. All of this stuff is subjective of course. I know that the Staff of TMF must have opinions on this; so... what are they?
Using Occams Razor, What is a solid, simple methodology to use to value management outside the obvious numbers found in financial statments?
This is a great question. Unfortunately, all I can offer is more subjective stuff. I often find myself arriving at an opinion of management only after reading numerous corporate filings - notably the annual proxy and the annual letter to shareholders. Probably most importantly, I rely very much on what management does, rather than what management says.
So, for example, random questions that assault me as I research a company.
* How much stock (not options) do these guys own? How did they get it? What's been their buying/selling history. Have they kept any options that they exercised (a very big positive, in my book).
* What has been the salary and bonus trend for executives? How is bonus determined? Does management disclose the criteria for bonuses? Are such criteria based on the economic returns of the business, or on easily "fudge-able" criteria. How have bonuses and other non-salary compensation been handled during periods of poor business performance?
* What's the make-up of the board? Is everyone elected annually (good), or are there entrenched multiple tranches (bad)? Are there outside connections between board members, or between board members and management? Really, look no further than Friendly Ice Cream (AMEX: FRN) write-up for an example of a really awful board.
* Has the CFO been buying stock? Talking to several academics (who, in general, seem to make lousy stockpickers - anecdotal evidence only), they've relayed some data suggesting that the CFO buying stock is the biggest indicator of outstanding future performance.
* What's the tenure of the board and senior executives? What's their background? Industry related or simply "professional board-sitters"? Have a look at the board and executive of Dawson Geophysical (Nasdaq: DWSN) for an excellent example of an experienced, tenured, and knowledgeable management.
* Are there any little side/sweetheart deals between management and the company. I generally dislike lease deals where management is leasing facilities to the company...although I'm sure the deals are at "market-appropriate rates". All-time great example was DHB back in the hey-day of David Brooks - former CEO. http://newsletters.fool.com/04/online-exclusives/updates/2006/04/06/060406xq0bluc.aspx
* Is there any deadweight on the management team/board? By deadweight, for example, look to see if the Chairman is a former CEO still getting paid a CEO's salary. This is a negative in my book. An example would be Universal Technical Institute (NYSE: UTI), where the Chairman is making mucho coin and continuing to lease facilities to the company. I consider this a black mark on a company that I otherwise like very much.
* How is the CEO compensated in aggregate? My all-time best example here is probably Garmin (Nasdaq: GRMN). The CEO takes a relatively piddling salary ($230K), and his annual bonus has been $203 (yes, you read that right....Two Hundred and Three dollars). Why $203? Well, Garmin has an annual Christmas bonus for all employees that, grossed-up to account for taxes, amounts to $203. Since the CEO is an employee - he gets it...and discloses it. A couple of years ago, his bonus spiked 12-fold (!) but it turns out that he was reporting his 15-year tenure bonus...again, an amount that all employees receive. Moreover, he takes no options and no restricted stock. He owns about 22% of the total shares though, so when the dividend gets paid, he makes a nice tidy sum. Of course, this option is open to all shareholders...want to get paid more from the company? Buy more stock!
So you can see, there's really no "quick cut". Rather, it's digging into the filings, and gaining a broad understanding of how management does things. Are they aligned with you the outside shareholder (i.e. GRMN)? Or do they have a history of enriching themselves without respect for the shareholder (i.e. FRN). This is probably not the answer you were seeking. It is, however, the only one I can offer.
Best,
Jim
My question still remains: how is the subjective measure of management combined with the objective measures of the company? But this is a good start, and I appreciate the post very much.
Thursday, February 01, 2007
How to integrate strategies?
One of my ongoing goals has been to figure out how to better analyze businesses in order to make better decisions regarding buying stocks. One method was to let the Motley Fool do it for me (initially with Hidden Gems, but now I'm considering additional services of theirs). Another strategy was to try to use my understanding of biotech to pick good stocks (what I call my One Up portfolio). My thinking about biotech stocks has actually developed quite a bit, so I think that the strategy has been informative if not profitable. The third was to combine complementary strategies that each have been shown to statistically beat the market. This is primarily based on MFI, combined with insider buying, low analyst coverage and, later, with Piotroski. This has worked to a reasonable extent - my IRR is pretty good, although the time slice is too short to say anything meaningful.
Now that I'm learning about how to gain a deeper understanding of businesses, how do I integrate these statistical strategies with more subjective ones? How to I rank a moat? How much weight do I put on - for example - debt level versus improving margins versus experienced management versus owner's earnings? I suppose that this is where the science blends into art. Any advice would be appreciated.
Tuesday, January 30, 2007
Short but sweet
VPHM closed at $17.02 today. This is my first double; I bought VPHM at $8.50 on 7-5-06.
Woohoo!
Sunday, January 07, 2007
New Year's Reading
I've had a few new books to read recently, my favorite of which has been The Warren Buffett Way by Robert Hagstrom, Jr. (Thanks to Steve for the book, on his own wedding day, of all times to be giving a gift!) Much of the book is an analysis of Buffett's own tenets in action. These sections did get a little repetitive. However, while these started out being very interesting and probably useful, even more helpful are the sections that summarize Buffett's tenets. These are:
- Business: Is the business understandable? Does it have a consistent operating history and favorable long-term prospects?
- Management: Is management rational? Candid? Does it resist the institutional imperative?
- Financial: Return on equity is what's important, not EPS. Calculate "owner earnings," look for high profit margins and make sure that the company has created at least one dollar of market value.
- Market: What is the value of the business? Is there a margin of safety relative to the value?
I expect that these ideas will help me a lot in thinking through businesses that I am considering investing in. My strengths are understanding probabilities of companies succeeding based on various strictly financial characteristics (PE, EY, ROIC, etc.). It is more difficult for me to think through the business aspects, and I think that these tenets will help to focus my thinking.
1. Understand how the company makes money. I remember reading somewhere that Ray Kroc insisted on owning the property of all McDonald's restaurants. He was in real estate, not in the restaurant business. I have the benefit (the 'One Up' advantage) of understanding biotech. (My most recent thinking about this, though may mean that it's a benefit that encourages me to be extremely selective. I'll probably write more about the problems that are specific to biotech at some point.)
2. What's the operating history? What does the future hold? The company doesn't have to always have been successful in every type of market, but perhaps the lows should be not so low - or should be the entry point. For the future, the best type of business to own is a franchise. The kind of company that can raise prices to keep up with inflation, for which there is no substitute, which sells something that is desired or needed, and whose profits are not regulated. In other words, it needs a moat. Most companies are somewhere in between, either a strong commodity, or a weak franchise.
Phil Town in Rule #1 describes five kinds of moats: Brand, Secret, Toll, Switching and Price. A brand is trusted or recognized, a secret involves patents or trade secrets. There is a toll when a company has exclusive control of the market (monopoly), switching is when there is a high barrier to changing providers, and price is when a company can price competitors out of the market. I suspect that price is the weakest moat: a new challenger may have a difficulty competing, but anyone who does automatically drives margins lower. In fact, Buffett prefers to avoid commodities, and a moat built solely on price essentially commoditizes what is being sold. (I think.)
3. Is management rational? Watch how management reinvests cash: does it earn more than you could earn elsewhere? Cash should either earn a high return or be returned to shareholders as a dividend or through share buybacks. Is management cadid? How do they discuss failures and problems? Listen to the conference calls for this. Do they avoid the institutional imperative? Will they take solutions to problems that cause short-term loss of profitability in exchange for long-term solutions and profitability?
4. ROE is more important that EPS, because increases in EPS don't take into account the company's (hopefully) growing cash base.
5. Calculate "owner earnings," which is Net Income + Depreciation/Depletion + Amortization - Capital Expenditures. Use this to determine the value of the business: Estimate the future cash flows of the business. How? Do the owner earnings show a consistent rate of growth? Use that rate. Then discount that rate by the rate of bonds. This gives the current value of the company. I'm not sure that I've completely grasped this; it's something to come back to. In particular, I know that Motley Fool is a proponent of free cash flow and owners' earnings, so I'll look into it there.
6. High profit margins are a sign of a strong business and of management that controls costs. Look at the margin over the years. I suspect that looking at the SG&A over time will also be informative.
7. Make sure that the company creates more than a dollar of market value for every dollar retained. It's apparently a simple calculation: Determine the retained earnings by subtracting the dividends paid from the net income. Sum the retained earnings over the last ten years. Compare this value to the change in market value over the last ten years. If more market value has been created than earnings retained, then the market has valued the company more highly than its earnings.
8. Insist on a margin of safety. Buffett insists on 25%. Phil Town stresses 50%. The difference between these is that Phil Town knows that he's teaching beginners who have a higher probability of having made a mistake somewhere along the way; Buffett has a better chance of correctly valuing a company that someone following Rule #1.
It is one of my major goals for the year to carry out more thorough analyses of purchases. I'm going to be looking for moats and good management more than anything else (MFI automatically finds companies selling cheaply relative to most recent earnings, although more complicated analyses could almost certainly refine the margin of safety.) I also like the idea of ensuring that the company creates more than a dollar of value per dollar retained.
Tuesday, December 12, 2006
UEPS rises! And other news...
Net 1 UEPS was up nearly 10% today! There doesn't appear to be any specific reason - no announcements, no news. I can only assume that millions of people read my previous posts analyzing UEPS. Clearly, they were convinced that UEPS is a great buy, and that sent the price straight up.
Williams Controls announced earnings today. They had increased in pretty much every way. Earnings were higher than last year, and higher than expected (by the one analyst that follows them). Sales had increased in the US and Europe, and increased dramatically in Asia. The share price hit a high of +3%, but settled back to +0.3%. Sheesh!
The other shoe dropped for ALNY. They announced how many shares they're going to sell, and that sent the price down 7%. I guess the difference between the situations of ALNY and ARNA was whether they had announced how much they're selling. Now they have been affected similarly by their announcements. Argh. Seems like I should have expected this, and should have profited from it. Oh well - I'll know for next time.
Finally, Walter had some things to say about the spin-off. It turns out that buying WLT will still allow participation in the Mueller spin-off. With a ~$16 price for MWA, and 1.65 shares of MWA per WLT, this means that each share of WLT will be worth ~$23 after the spin-off. Is this a fair value? I need to look into this a little more. Just notice, though, that the Market Cap of MWA is 1.8B, and that of WLT is 2.1B. WLT owns 75% of MWA, so the market is valuing WLT as ~$750M. With 43M shares, WLT is valued at ~$18 per share. Less than the spin-off value. Is this right?
Sunday, December 10, 2006
My Experiment in LEAPs
I wondered a while back whether buying LEAPs would be a way to leverage the MFI for greater gains. On August 8, I recorded the 38 MFI stocks that had options available. For each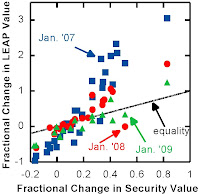 stock, I recorded the close price, as well as the close price of Jan. '07, '08 and '09 LEAPs with a strike price just below the close price of the security. Now, 4 months later, using the close as of December 8, I have determined the change in security and derivative values. LEAP values that expire in Jan. '08 and '09 changed in close accordance with stock price. (Click on the figure, and all figures, to expand them.) As the Jan. '07 expiry date approached, the LEAPs changed in price, in many cases dramatically. Of the 32 stocks that had options expiring in Jan. '07, the mean ± SD was 0.51 ± 1.05. This is a huge gain in that period of time, but much greater variability. The median change in value was 12%.
stock, I recorded the close price, as well as the close price of Jan. '07, '08 and '09 LEAPs with a strike price just below the close price of the security. Now, 4 months later, using the close as of December 8, I have determined the change in security and derivative values. LEAP values that expire in Jan. '08 and '09 changed in close accordance with stock price. (Click on the figure, and all figures, to expand them.) As the Jan. '07 expiry date approached, the LEAPs changed in price, in many cases dramatically. Of the 32 stocks that had options expiring in Jan. '07, the mean ± SD was 0.51 ± 1.05. This is a huge gain in that period of time, but much greater variability. The median change in value was 12%.Here's another way of looking at it: What is the fraction of LEAPs that changed 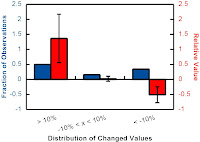 by more than 10%? Figure 2 shows the distribution of LEAP by amount gained, as well as the gain for each category of LEAP. I think it is valid to then calculate an expected return: multiply the fraction in each category by the return of the category for an expected return in each category. By summing the expected returns of each category, you get the overall expected return, which is 17%.
 by more than 10%? Figure 2 shows the distribution of LEAP by amount gained, as well as the gain for each category of LEAP. I think it is valid to then calculate an expected return: multiply the fraction in each category by the return of the category for an expected return in each category. By summing the expected returns of each category, you get the overall expected return, which is 17%.
Another way to do this, and probably the most accurate, is with a bootstrap method. Randomly generate portfolios of 5 LEAPs many times, and the average return of the portfolios is the expected return of this strategy. Using this strategy, the mean ± SD is 59.8% ± 41.4%, based on 50 portfolios. Only 3 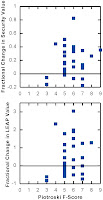 of the 50 portfolios resulted in a loss, averaging -11% ± 6.5%. By comparison, 11 of the 50 porfolios ended up more than doubling, with average returns of 115% ± 17%.
 of the 50 portfolios resulted in a loss, averaging -11% ± 6.5%. By comparison, 11 of the 50 porfolios ended up more than doubling, with average returns of 115% ± 17%.
Is there a correlation to Market Cap? Piotroski F-Score? There doesn't seem to be a correlation between either and returns. The distribution of returns by F-Score is pretty broadly distributed; there aren't really enough samples at most F-Scores to say. Similarly, if there is an effect of market cap, it is slight: the Pearson's coefficient of the curve fit suggests that market cap explains only ~2.5% of the variation - really not enough to be interesting for further study.
There are definite caveats to this. It's one sample of stocks, from a period when the general market is doing exceptionally well. This would really need more thorough backtesting to 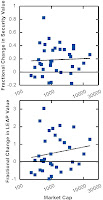 have a better idea whether using LEAPs of MFI stocks improve returns. But, this data suggests that there may be an advantage to buying LEAPs of MFI stocks as compared to the stocks themselves.
 have a better idea whether using LEAPs of MFI stocks improve returns. But, this data suggests that there may be an advantage to buying LEAPs of MFI stocks as compared to the stocks themselves.
Friday, December 08, 2006
December buys, part I
My goal with this round of picks was to try two things: 1) to take a little more into account when buying stocks than just insider buying and 2) to try to analyze the stocks that I buy. #1 was solved by using the Piotroski F-Score to help me pick stocks. This is also a  sort of short cut to #2, but only partly. So, in keeping with my previous analysis of MFI stocks, here's an analysis of the top 100 stocks with a market cap of at least $1M. (Actually, because of errors acquiring the F-Scores of a nuber of stocks, the actual sample size was 77.) It's a skewed distribution, weighted towards stocks with 'good' company characteristics, as defined by the F-Score. If you compare this distribution to that of my last analysis, there is a remarkable similarity (comparing to the distribution of companies with a market cap of at least $1M). Also, companies with higher F-Scores had larger market caps.
 sort of short cut to #2, but only partly. So, in keeping with my previous analysis of MFI stocks, here's an analysis of the top 100 stocks with a market cap of at least $1M. (Actually, because of errors acquiring the F-Scores of a nuber of stocks, the actual sample size was 77.) It's a skewed distribution, weighted towards stocks with 'good' company characteristics, as defined by the F-Score. If you compare this distribution to that of my last analysis, there is a remarkable similarity (comparing to the distribution of companies with a market cap of at least $1M). Also, companies with higher F-Scores had larger market caps.

Of those 77, 22 had insider purchases. Only one of those had a Piotroski F-Score of 9, PACR, so I decided on that as a definite purchase. Three companies had a F-Score of 8, but of those, two had very low insider ownership. The last of these was WMCO, so that went on the list. FCX just announced the acquisition of PD, and there is a rumor of a takeover bid for FCX itself. Also, considering the size of FCX, it's insider ownership of ~5% seems pretty high. So with a F-Score of 7, FCX joined the list. The number of insider shares purchased by GVHR (620K!) got it added to the list, despite a F-Score of only 6. Finally, the excel add-in returned an error for F-Score of OFLX , but this article and the insider purchases (6 since June, by 5 separate officers of the company) got it on the list.
This is at best a partial success - let's face it, I'm still mechanically using F-Score as a proxy for fundamental analysis and I'm considering insider buying as a substitute for my own valuation. But it's a place to start. If you look at the logic above, insider buying still trumps fundamentals, too (GVHR got in with a 6, OFLX didn't have a clean analysis). So here's some fundamental analysis, using the questions outlined by Browne:
GVHR: Current assets : current liabilities are about even, but he'd prefer to see at least 2:1. LT assets are up ~ 30% compared to last year and up 10% compared to last quarter. LT liabilities are flat yoy, but appear to have been paid down somewhat since last quarter. PB is 4.3. Cost of revenue is not going up as quickly as revenue is, so there is more falling to the bottom line. Indeed, gross profit and EBIT are up yoy. Return on capital is 60%, a nice MFI number. Profit margins are flat, though.
FCX: Current assets are 2:1 with current liabilities, so that's good. LT assets are flat, while LT liabilities declined since last quarter. PB is ~12. ROC was huge last year, ~100%, but a more modest 28% the year before.
WMCO: Current assets to current liabilites are 1:1. LT assets are flat yoy, while LT liabilities declined nearly 40%. This is the first year of the last three that WMCO is profitable. EBIT was up 27% last year, and 17% the year before. ROC was huge.
(I didn't get to PACR or OFLX before this posting.)
The question is, do these analyses indicate that these companies are good or not? None of these seem to be as good as UEPS... does that mean that I have a skewed perspective of what is good, or is that a true, objective evaluation? I still have a lot to learn. Luckily, I am learning it in an up market, so mistakes are perhaps less costly than they could be.
OK, OK, if I'm making mistakes, they have, so far, been of the luckily good kind. But until I can do more fundamental analysis, it's just luck. Actually, it's statistics - since MFI stocks historically do well, and stocks with high insider buying historically do well, I am perhaps skewing my probabilities in the right direction.
WIld ride
Wow! I'm pretty amazed at how things have been going. I am trying very hard to remain skeptical, but my overall gain is pretty exciting.
I started my next round of buying today. It actually should have been last month, but something kept me from it then. So today I bought my next round of MFI picks. Probably Monday will be my next round of Motley Fool picks. Before discussing what's new, here's a rundown of my portfolios to date.
 have been last month, but something kept me from it then. So today I bought my next round of MFI picks. Probably Monday will be my next round of Motley Fool picks. Before discussing what's new, here's a rundown of my portfolios to date.
MFI is kicking butt. 4 of 10 stocks are up dramatically, while 3 are down, one a lot (ASPV, nearly 20%). VPHM is flying, with DECK, ASEI and WNR trailing. VPHM discussed prospects at two health science conferences a couple of weeks ago, and the shares just kept going up over the course of those couple of days. ASEI has also been doing great lately - i was up more than $4 the other day, although it gave back ~$1.50 the next day. Really, this doesn't seem to be on any specific news - maybe Mr. Market is starting to value ASEI more appropriately? Also, notice that MFI is trouncing the indices. Finally, my IRR for my MFI portfolio is 59%, based on 5 months of data. Too short to conclude anything, but a nice start nonetheless.
The Motley Fool portfolio is also doing very nicely. This porfolio seems a little more  consistent: only 2 of 10 are down, and one of those is OYO the yo-yo. The rest are all up to various extents - it's still a large range, but even the least of them is significant - NATH at 8%. The IRR of my HG portfolio is 62.6%
 consistent: only 2 of 10 are down, and one of those is OYO the yo-yo. The rest are all up to various extents - it's still a large range, but even the least of them is significant - NATH at 8%. The IRR of my HG portfolio is 62.6%
There's my special situations portfolio. I haven't been discussing this much, because it has until recently been only one stock. I held on to LPMA after the merger, so now it's PAY. This stock has been doing nothing but rising since the merger closed - it is up ~20% since the deal closed Nov 1. I got very nervous when PAY stalled at around $32-33, and again when the earnings announcement approached. Now they're in the clear, earnings were good, and the announcement seems fine for the coming year. By a convenient coincidence, I'm reading The Warren Buffett Way by Robert Hagstrom. In it, he quotes Buffett as saying (and I'm paraphrasing) that if you know what the company is worth, then you decide the price; if you don't then the market decides the price. As nervous as I was about what to do with PAY, I realized that I don't have a sufficiently good understanding of the underlying fundamentals to decide whether Mr. Market is crazy and overvaluing or undervaluing PAY. What I'm still trying to figure out is, what do you do if the market is overvaluing the company? Sell and possibly miss out on more upside? Wait for a downturn and sell? Or sell part of the position? I've lately been listening to Jim Cramer's radio show (as a podcast), and his quote is, "Bulls make money, bears make money, but hogs get slaughtered." I wonder whether he'd tell me to take some off the table. PAY is currently the largest single position in my portfolio.
Lately, I've also become interested in TARR. It's in the dreaded housing industry. The PE is low (it was quite a bit lower when I first found the company in a stock screen), it trades near book value and it's got a high return on assets. Also, there have been a bunch of insider purchases, many of which were at prices well above where it trades now, and by several insiders. Last but not least, they are considering spinning off their homebuilding division by mid 2007. That was the icing on the cake. I do worry a little about how highly leveraged they are, but from what I've been hearing and reading, it sounds as though the housing industry is either near the bottom or possibly even just starting to turn around. If this is true, the TARR might be a great play, with a lot of potential upside. My total return on my special situations portfolio is 21%. I won't even mention the ridiculous IRR, because there's too little data in terms of total time (100 days) and total positions (2).
Finally, there's my biotech portfolio. It's full of surprises and disappointments. CBST continues to disappoint. It gapped down today, on a downgrade by Piper Jaffray. I'm not sure how much longer I will think that the market is wrong and maintain a large position in CBST. I do think that I'm right, and that it will turn a nice profit as cubicin starts to displace vancomycin (from VPHM). If I were really confident, I suppose I'd buy more, not consider selling. This is another position that requires that I do more research. CBST also announced that they'd partnered with AstraZeneca to distribute cubicin in China. It would have been nice had they thought they could bring the drug to that market, but the royalties will be alright. Both ARNA and ALNY have risen - ARNA dropped back down, but ALNY is just going higher and higher. What's interesting about the ALNY and ARNA stories is what's similar about them: they both announced that they'd sell shares. Why? The officers must believe that the shares are overvalued. The market ignored the ALNY announcement, but ARNA plummeted (still up overall, but down dramatically from their high). Now ARNA announced the sell price, and for some reason, the stock went to well above that price. Strange - I would have thought that would have set the price, rather than selling the bottom for the price. Anyway, the fact of the companies selling shares has made me wonder whether to sell as well. Or at least to take some off the table. ALNY especially has just kicked butt, mainly, I thought, because of the RNAI purchase and speculation that ALNY is also a buyout target. Not sure what I'll do for now.
 they thought they could bring the drug to that market, but the royalties will be alright. Both ARNA and ALNY have risen - ARNA dropped back down, but ALNY is just going higher and higher. What's interesting about the ALNY and ARNA stories is what's similar about them: they both announced that they'd sell shares. Why? The officers must believe that the shares are overvalued. The market ignored the ALNY announcement, but ARNA plummeted (still up overall, but down dramatically from their high). Now ARNA announced the sell price, and for some reason, the stock went to well above that price. Strange - I would have thought that would have set the price, rather than selling the bottom for the price. Anyway, the fact of the companies selling shares has made me wonder whether to sell as well. Or at least to take some off the table. ALNY especially has just kicked butt, mainly, I thought, because of the RNAI purchase and speculation that ALNY is also a buyout target. Not sure what I'll do for now.
As an aside to the discussion of my biotech portfolio, I have major seller's regret over MEDX. They have been going up like crazy over the last couple of weeks, and now yesterday one of their drugs was fast-tracked by the FDA. I'm considering getting back in MEDX, but in a several purchases at a time, so that I benefit if it goes down at all (another Cramerism).
This turned out to be a long post, so I'll discuss my new MFI purchases in a separate entry.
Thursday, November 30, 2006
Great returns so far - but so what?
Thanks to justadrone from the yahoo MFI group, I just calculated my annualized internal rate of return. I'm still trying to figure out exactly what an IRR is. It seems to not only give the growth rate, but also to take into account the effect of cash flows - and this is the part that I'm still working on understanding. In any case, I think that the annualized IRR for my total portfolio is pretty awesome - it's just over 50%. After nearly five months, this may be long enough to start to be meaningful. On the other hand, the market has been going up like crazy since about July or so, meaning that I'm going to try not to consider this kind of return rate anything near 'normal'.
Even if I calculate my return using a method that I understand better - calculate the percent increase, divide by the number of months invested, multiply by twelve months of the year - I still get well over 30% annualized returns.
Let's see if I can keep up something even close.
I've just been reading Fooled by Randomness - so this leads me to believe that beating the market by a few percentage points is attributable to nothing other than luck. I think that occassionally reading that book, and anything else by Taleb, will be a good way to try to stay skeptical of any success.
Sunday, November 26, 2006
UEPS in the Mayo Clinic
Continuing with the analysis of UEPS as recommended by Christopher Browne in The Little Book of Value Investing, now is the part that I suppose is more art and less science, at least as compared to income and balance sheet analysis.
1. Can the company raise prices?
The answer is no. The product is for people without access to banks, or people for whom bank fees are prohibitive. These are not people who can afford to pay more. The UEPS model requires more people to be part of their network, not to charge their network high fees. Having said that, though, they are positioned to find new applications for their smartcard products - both geographically (old applications in new countries) and systematically (new applications in established countries).
2. Can the company sell more?
Definitely. Their technology has been broadly adopted in South Africa, they currently operate in Namibia, Botswana and Nigeria, and are exploring opportunities in nearby African countries, as well as a number of South American and South Asian countries. Third parties are operating their technology in Malawi, Mozambique, Zimbabwe, Ghana, Rwanda, Burundi and Latvia. I would prefer that they were operating their own technology - to me this means that perhaps they couldn't keep make the most of their technology, and so resorted to licensing it out. But it's a start. In addition, they mainly operate by distribution of social welfare and payroll distribution; but they've identified additional mechanisms for adoption, including medical welfare distribution.
3. Can they increase profits on existing sales?
Not sure. Probably not, at least not any time soon. They need to expand as much as possible. Once much better established, they could probably spend less on network expansion, increasing the number of point of sales card readers, possibly once better established they can rely on government contracts to a greater extent than they do now. But for now, they need to reinvest the money they make into expansion. Revenue has gone up, but cost of goods sold has remained constant for 2005 and 2006.
4. Can the company control expenses? What is the outlook for SG&A?
SG&A went up $6M in 2005, and $3M in 2006. I showed earlier that SG&A is declining as a percentage of gross revenue, and this seems to indicate that the company is indeed controlling expenses.
5. If the company raises sales, how much goes to the bottom line?
Comparing 2006 and 2005 as an example, revenues went up a ton, cost of goods sold was constant, SG&A went up just a bit. This seems to be asking about the net profit margin, and I showed that this is increasing yearly. So historically, they've been successful with this - the question is whether they'll continue to do so, but there's no reason to think that they will not.
6. Can the company be as profitable as it used to be, or at least as profitable as its competitors?
The company is increasing profitability year-over-year. I'll compare it to competitors shortly.
7. Does the company have one-time expenses that won't need to be paid in the future?
1. Can the company raise prices?
The answer is no. The product is for people without access to banks, or people for whom bank fees are prohibitive. These are not people who can afford to pay more. The UEPS model requires more people to be part of their network, not to charge their network high fees. Having said that, though, they are positioned to find new applications for their smartcard products - both geographically (old applications in new countries) and systematically (new applications in established countries).
2. Can the company sell more?
Definitely. Their technology has been broadly adopted in South Africa, they currently operate in Namibia, Botswana and Nigeria, and are exploring opportunities in nearby African countries, as well as a number of South American and South Asian countries. Third parties are operating their technology in Malawi, Mozambique, Zimbabwe, Ghana, Rwanda, Burundi and Latvia. I would prefer that they were operating their own technology - to me this means that perhaps they couldn't keep make the most of their technology, and so resorted to licensing it out. But it's a start. In addition, they mainly operate by distribution of social welfare and payroll distribution; but they've identified additional mechanisms for adoption, including medical welfare distribution.
3. Can they increase profits on existing sales?
Not sure. Probably not, at least not any time soon. They need to expand as much as possible. Once much better established, they could probably spend less on network expansion, increasing the number of point of sales card readers, possibly once better established they can rely on government contracts to a greater extent than they do now. But for now, they need to reinvest the money they make into expansion. Revenue has gone up, but cost of goods sold has remained constant for 2005 and 2006.
4. Can the company control expenses? What is the outlook for SG&A?
SG&A went up $6M in 2005, and $3M in 2006. I showed earlier that SG&A is declining as a percentage of gross revenue, and this seems to indicate that the company is indeed controlling expenses.
5. If the company raises sales, how much goes to the bottom line?
Comparing 2006 and 2005 as an example, revenues went up a ton, cost of goods sold was constant, SG&A went up just a bit. This seems to be asking about the net profit margin, and I showed that this is increasing yearly. So historically, they've been successful with this - the question is whether they'll continue to do so, but there's no reason to think that they will not.
6. Can the company be as profitable as it used to be, or at least as profitable as its competitors?
The company is increasing profitability year-over-year. I'll compare it to competitors shortly.
7. Does the company have one-time expenses that won't need to be paid in the future?
They acquired Prism in 2006, but after the end of the fiscal year. Next year will have a $95.2M charge that is one-time. There was a similar charge in 2004, for reorganization involved in the acquisition of Aplitec.
8. Does the company have unprofitable ops they can shed?
I don't see any.
9. Is the company comfortable with Wall Street earnings estimates?
They don't seem to discuss earnings estimates in the annual report. According to Yahoo! Finance, they seem to have come in within pennies of analyst earnings estimates in recent quarters.
10. How will the company grow in the next five years? How?
I've pretty much covered this one. It looks as though they have some pretty good prospects for growth.
11. What will the company do with excess cash?
Seems as though it will be reinvested in the company for continued growth.
12. What does the company expect its competitors to do?
They don't seem to discuss this much. They do discuss the risks of competitors, including retail banks as well as other companies that are direct competitors, but not much of what they think their strategy will be. Basically, the risks are that users will prefer special bank accounts that offer reduced charges, or that they will prefer their competitors.
13. How does the company compare financially to competitors?
I'll get into this shortly.
14. What would the company be worth if it were sold?
Hm. Interesting question. It seems that each industry has some 'typical' multiple of cash flow that is how it is valued for buyout. I'm not sure how to figure this out, but I'll play around with some numbers and come back to this.
15. Does the company plan to buy back stock?
I don't see plans to do so, but the company did buy back nearly 150,000 shares at $26.75, more than the price it's trading at now. However, this seems to have been somehow tied to purchases made by employees, maybe in a company stock puchase plan.
16. Are insiders buying?
One director bought a ton in June; A number of officers exercised options in June and one more did as well in September, all without selling their options immediately. Perhaps the options were going to expire; but I've read somewhere that exercising the options but not selling may be a sign that they are very bullish - that it somehow minimizes the tax implication for the potential gain.
Saturday, November 25, 2006
Back to the financial experiment...
I had wondered in a previous post about why larger cap MFI companies tended to have higher Piotroski F-scores. I realized recently that I had failed to consider an important explanation. Chances were good that they didn't grow to be a large cap without being a fairly good company, especially considering that these large cap companies had high return on invested capital. In other words, the fact of being both a large cap and a MFI company should both correlate well with scoring highly on the Piotroski scale.
Saturday, November 18, 2006
Part II
From the balance sheet to the income statement, it’s time for part II of the physical exam of UEPS.
Step 1: Revenue is listed for 2004 through 2006, and increased each year. 11.2% in 2006, and 34.5% in 2005. It is not particularly encouraging that revenue growth declined. Have they made the largest gains in market penetration (really, creation, given what they do)? This is probably why they are looking to diversify into new countries.
Step 2: The cost of goods sold increased by ~20% in 2005, but remained unchanged in 2006. As they grow as a company, does this indicate that they are streamlining production? Have they found cheaper labor or materials or products? It is perhaps a network effect: once the network is in place, there are perhaps only smaller charges to maintain it.
Step 3: Gross profit is revenue minus the cost of goods sold. 2006 - $146M; 2005 - $126M; 2004 - $92M. So, gross profit is increasing yearly. Browne says that he likes for this number to be stable, but clearly it isn’t. I suspect that is typically for a more mature company, but who knows?
Step 4: Determine operating profit by subtracting SG&A from gross profit. 2006 - $97M; 2005 - $80M; 2004 - $52M. As a % of gross revenue: 2006 – 32%; 2005 – 37%; 2004 – 43%. So with this number coming down percentagewise, this is probably a good thing. Browne says that this is the earnings before interest and taxes, EBIT, that is so important for the MFI, actually, and, Browne continues, this is the number that is used to value the company, including people looking to acquire it. The UEPS income statement includes depreciation and amortization in calculating the operating profit, as well as reorganization charges in 2004 and costs associated with the IPO and continued Nasdaq listing. The Nasdaq charge is probably more or less recurring, but it seems to me that the IPO cost and the reorganization charges should probably be ignored for calculating EBIT. And when depreciation and amortization are included, it becomes EBITDA. I’ve heard elsewhere that EBIT is more important than EBITDA.
Step 5: Calculate EPS. It took a little searching in the annual report to find a clear statement of the number of shares outstanding, but finally, the “Total weighted average number of outstanding shares used to calculate earnings per share – diluted” is 57.3M. So, using EBIT as earnings, EPS is 97 / 57.3 = $1.69. Using nondiluted shares EPS = $1.72, not a big difference at all. And looking at the other 2 years: 2005 – dil, $1.43, nondil, $1.46; 2004 – dil, $1.50, nondil, $1.56. A large number of shares were issued in 2005, increasing the number of shares 60%. So that explains the drop in EPS in 2005, but now in 2006, the EPS has more than made up for the dilution of ownership.
Step 6: Calculate the ROC: Divide the earnings of any year by the beginning year’s capital (ie, the end of the previous year), which is the shareholder’s equity and total liabilities. In this case, then the EBIT for 2006 is $97M, while the capital is $182M. ROC is 53%. ROC is of course one of the two measures for identifying MFI stocks, and this is a pretty high number for ROC. I’m encouraged that I came up with a number that seems appropriate for a MFI stock.
Step 7: The net profit margin is the earnings divided by the total revenues, presumably using EBIT as earnings. 2006 – 49%; 2005 – 45%; 2004 – 40%. So profit margins are increasing, which means that reinvesting cash in the company is leveraging sales.
Coming up is taking the stock to the mayo clinic. This one has more to do with everything the company has to say about their business, and less to do with the balance sheet and the income statement. This part is harder, and I’ll wait a little for it.
One last thing: I bought UEPS at $24.64. With EPS of $1.69, this gives an earnings yield of 7%. This sounds low for a MFI stock. When I get back the Little Book That Beats the Market, I’ll have to double check how EY is calculated for MFI.
But overall – that wasn’t so hard. Really.
Step 1: Revenue is listed for 2004 through 2006, and increased each year. 11.2% in 2006, and 34.5% in 2005. It is not particularly encouraging that revenue growth declined. Have they made the largest gains in market penetration (really, creation, given what they do)? This is probably why they are looking to diversify into new countries.
Step 2: The cost of goods sold increased by ~20% in 2005, but remained unchanged in 2006. As they grow as a company, does this indicate that they are streamlining production? Have they found cheaper labor or materials or products? It is perhaps a network effect: once the network is in place, there are perhaps only smaller charges to maintain it.
Step 3: Gross profit is revenue minus the cost of goods sold. 2006 - $146M; 2005 - $126M; 2004 - $92M. So, gross profit is increasing yearly. Browne says that he likes for this number to be stable, but clearly it isn’t. I suspect that is typically for a more mature company, but who knows?
Step 4: Determine operating profit by subtracting SG&A from gross profit. 2006 - $97M; 2005 - $80M; 2004 - $52M. As a % of gross revenue: 2006 – 32%; 2005 – 37%; 2004 – 43%. So with this number coming down percentagewise, this is probably a good thing. Browne says that this is the earnings before interest and taxes, EBIT, that is so important for the MFI, actually, and, Browne continues, this is the number that is used to value the company, including people looking to acquire it. The UEPS income statement includes depreciation and amortization in calculating the operating profit, as well as reorganization charges in 2004 and costs associated with the IPO and continued Nasdaq listing. The Nasdaq charge is probably more or less recurring, but it seems to me that the IPO cost and the reorganization charges should probably be ignored for calculating EBIT. And when depreciation and amortization are included, it becomes EBITDA. I’ve heard elsewhere that EBIT is more important than EBITDA.
Step 5: Calculate EPS. It took a little searching in the annual report to find a clear statement of the number of shares outstanding, but finally, the “Total weighted average number of outstanding shares used to calculate earnings per share – diluted” is 57.3M. So, using EBIT as earnings, EPS is 97 / 57.3 = $1.69. Using nondiluted shares EPS = $1.72, not a big difference at all. And looking at the other 2 years: 2005 – dil, $1.43, nondil, $1.46; 2004 – dil, $1.50, nondil, $1.56. A large number of shares were issued in 2005, increasing the number of shares 60%. So that explains the drop in EPS in 2005, but now in 2006, the EPS has more than made up for the dilution of ownership.
Step 6: Calculate the ROC: Divide the earnings of any year by the beginning year’s capital (ie, the end of the previous year), which is the shareholder’s equity and total liabilities. In this case, then the EBIT for 2006 is $97M, while the capital is $182M. ROC is 53%. ROC is of course one of the two measures for identifying MFI stocks, and this is a pretty high number for ROC. I’m encouraged that I came up with a number that seems appropriate for a MFI stock.
Step 7: The net profit margin is the earnings divided by the total revenues, presumably using EBIT as earnings. 2006 – 49%; 2005 – 45%; 2004 – 40%. So profit margins are increasing, which means that reinvesting cash in the company is leveraging sales.
Coming up is taking the stock to the mayo clinic. This one has more to do with everything the company has to say about their business, and less to do with the balance sheet and the income statement. This part is harder, and I’ll wait a little for it.
One last thing: I bought UEPS at $24.64. With EPS of $1.69, this gives an earnings yield of 7%. This sounds low for a MFI stock. When I get back the Little Book That Beats the Market, I’ll have to double check how EY is calculated for MFI.
But overall – that wasn’t so hard. Really.
You've taken your first step into a larger world - Obi-Wan Kenobi
I just read the Little Book of Value Investing by Christopher Browne. One of the original value investors, along with his partners at Tweedy, Browne, he worked with Benjamin Graham and Warren Buffett in their early years. I read the paper by Tweedy, Browne called, “What has worked in investing.” It’s pretty much the same sort of thing but with more hard data and fewer anecdotes. All in all, yes, I’m convinced.
The most directly useful part of the book are three chapters that discuss how to value a company. Coincidentally, the same day that I finished the book, I received in the mail the year-end report for Net 1 UEPS, one of the stocks that I own in my MFI portfolio. I decided to evaluate UEPS using the steps outlined by Browne (he doesn’t actually list them as ‘steps’ – these are my arbitrary divisions of his commentary). Here goes.
Step 1: Current assets and current liabilities. The current assets are ~$240M, and the current liabilities are ~$40M, so the current ratio is 6. Browne says at least 2:1 – UEPS is doing well. The working capital is ~$200M; Browne says the more the better. The quick ratio is the (current assets – inventory) / current liabilities. Inventory is only ~$2M, so the quick ratio is only marginally different from the current ratio.
The 2005 current ratio was roughly 5, and the working capital was ~$115M. So 2006 seems an improvement over 2005.
Step 2: Long term assets and liabilities. Total LT assets are ~$29M; Browne says to subtract out intangibles and goodwill, so he would consider LT assets as ~$11M. The only long-term debt listed is deferred income taxes, at ~$18M. How does this compare to last year? In 2005, LT assets were ~$30M, or ~$9M excluding intangibles and goodwill. LT liabilities were ~$10M in 2005. So, LT assets (excluding intangibles) went up ~20%, while LT liabilities increased 80%. However, the long-term liabilities are small compared to cash on hand, never mind short-term assets. This seems healthy.
Step 3: Book value. Subtract all that the company owns from all that it owes: $209M. Browne suggests subtracting intangibles here as well, so the book value is $189M. The debt to equity ratio is ~0.3. This means that the company is funded primarily through investment. In 2005, this value was ~0.4, so this also seems to be improving. Browne says that even if this number is greater than 1 it’s not the end of the world, so the small improvement in debt to equity ratio seems not particularly important. What is important, I think, is that the value is significantly less than 1.
I’m going to skip step 5 for now: comparing the book value of UEPS to its competitors. This brings me to the end of the first chapter about evaluating a company, and it seems that the balance sheet shows that UEPS has a solid foundation.
The most directly useful part of the book are three chapters that discuss how to value a company. Coincidentally, the same day that I finished the book, I received in the mail the year-end report for Net 1 UEPS, one of the stocks that I own in my MFI portfolio. I decided to evaluate UEPS using the steps outlined by Browne (he doesn’t actually list them as ‘steps’ – these are my arbitrary divisions of his commentary). Here goes.
Step 1: Current assets and current liabilities. The current assets are ~$240M, and the current liabilities are ~$40M, so the current ratio is 6. Browne says at least 2:1 – UEPS is doing well. The working capital is ~$200M; Browne says the more the better. The quick ratio is the (current assets – inventory) / current liabilities. Inventory is only ~$2M, so the quick ratio is only marginally different from the current ratio.
The 2005 current ratio was roughly 5, and the working capital was ~$115M. So 2006 seems an improvement over 2005.
Step 2: Long term assets and liabilities. Total LT assets are ~$29M; Browne says to subtract out intangibles and goodwill, so he would consider LT assets as ~$11M. The only long-term debt listed is deferred income taxes, at ~$18M. How does this compare to last year? In 2005, LT assets were ~$30M, or ~$9M excluding intangibles and goodwill. LT liabilities were ~$10M in 2005. So, LT assets (excluding intangibles) went up ~20%, while LT liabilities increased 80%. However, the long-term liabilities are small compared to cash on hand, never mind short-term assets. This seems healthy.
Step 3: Book value. Subtract all that the company owns from all that it owes: $209M. Browne suggests subtracting intangibles here as well, so the book value is $189M. The debt to equity ratio is ~0.3. This means that the company is funded primarily through investment. In 2005, this value was ~0.4, so this also seems to be improving. Browne says that even if this number is greater than 1 it’s not the end of the world, so the small improvement in debt to equity ratio seems not particularly important. What is important, I think, is that the value is significantly less than 1.
I’m going to skip step 5 for now: comparing the book value of UEPS to its competitors. This brings me to the end of the first chapter about evaluating a company, and it seems that the balance sheet shows that UEPS has a solid foundation.
Tuesday, October 31, 2006
Earnings Announcements, Update, and ASPV Thoughts
I've only been through a couple of earnings announcement seasons, now, but it seems like an exciting time. Like Piotroski said, something like 1/6 of a stock's movement comes over the combined four days of the year that the company annouces earnings.
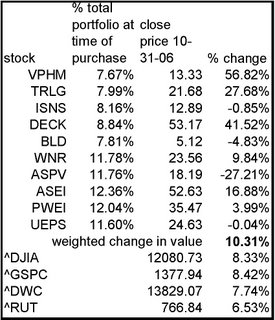
DECK kicked butt, reporting $0.83 per share, up from $0.63 compared to the same quarter last year. This blew away analyst estimates of $0.54, and the stock price jumped ~ 8%.
ISNS stunk it up. BLD was flat with last year. ALDN beat estimates by $0.03, and stayed pretty much flat, also.
SCSS came ahead of analysts estimates, but said that sales slowed towards the end of the quarter and so the stock price slid 17%.
Income nearly tripled for ATHR with 74% increased sales.
ARNA lost $20M on R&D, and stayed high, still for no real reason. It seems to have settled at ~$15, and as long as it stays around here, I'm happy.
Merck bought Sirna at a huge 100% premium. This sent ALNY up ~20%, as pretty much the only independant microRNA company left. Pretty sweet.
DECK kicked butt, reporting $0.83 per share, up from $0.63 compared to the same quarter last year. This blew away analyst estimates of $0.54, and the stock price jumped ~ 8%.
ISNS stunk it up. BLD was flat with last year. ALDN beat estimates by $0.03, and stayed pretty much flat, also.
SCSS came ahead of analysts estimates, but said that sales slowed towards the end of the quarter and so the stock price slid 17%.
Income nearly tripled for ATHR with 74% increased sales.
ARNA lost $20M on R&D, and stayed high, still for no real reason. It seems to have settled at ~$15, and as long as it stays around here, I'm happy.
Merck bought Sirna at a huge 100% premium. This sent ALNY up ~20%, as pretty much the only independant microRNA company left. Pretty sweet.
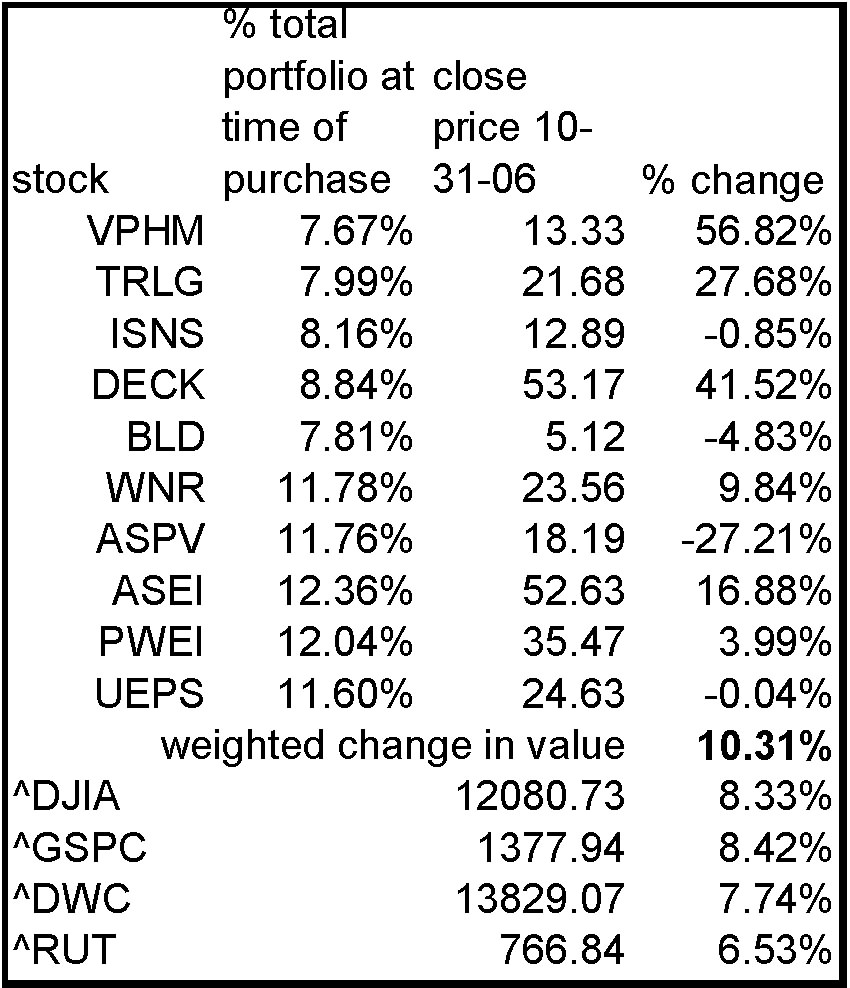
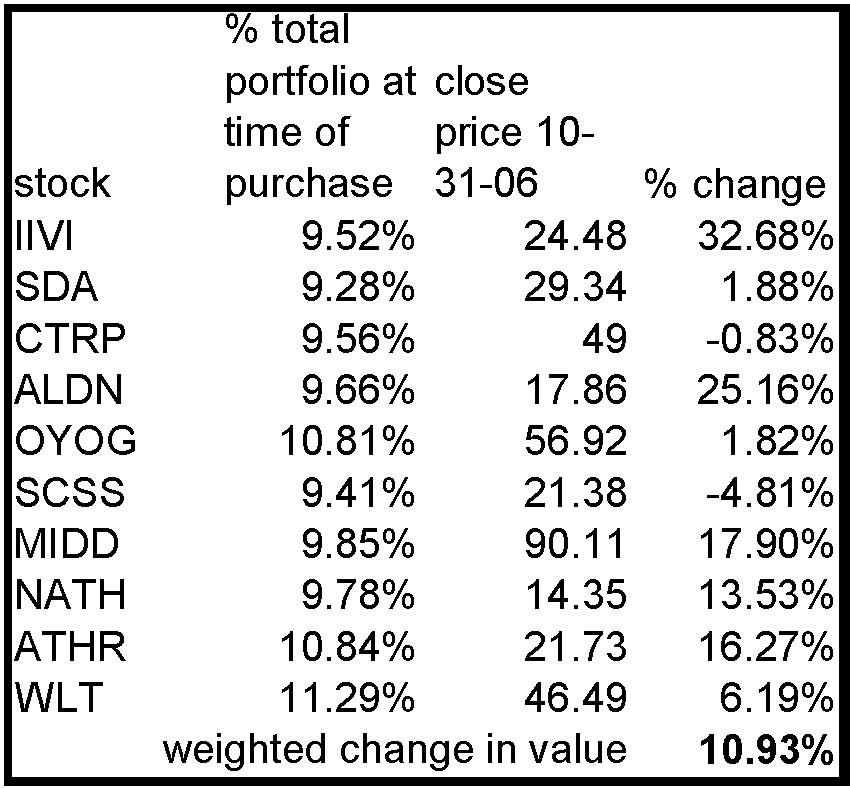
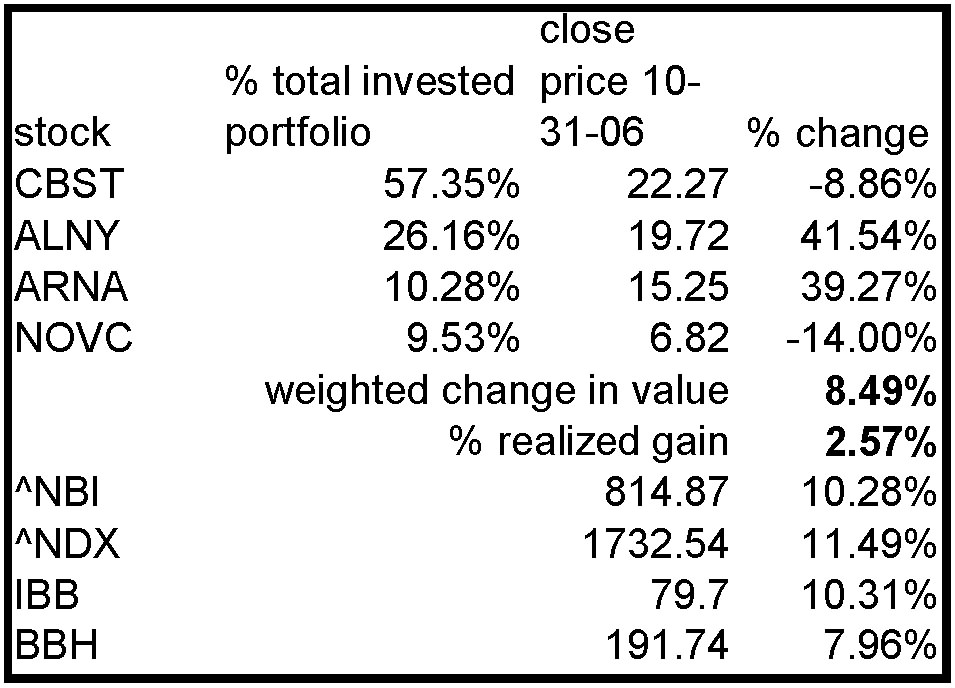
That leaves one company, which I'll save for the end of the post. My three portfolios are up. That's a pretty big thrill for a beginner like me. The biotech portfolio is not doing as well as the biotech indices, even after ALNY's boom. I still have some faith in CBST, but it is wavering a little. Basically, as it begins to show consistent profit in the next few quarters, I'd like to think that the share price will go up. However, as I'm starting to figure out, part of that expectation is already priced in, so CBST has to perform particularly well. That is the source of the wavering faith in it. NOVC seems to have some on-deck drugs in late-phase trials. Assuming those go moderately well, it'll spike. I'm pretty happy with both my MFI and HG portfolios. These are beating the market, and kicking butt compared to the Russell 2K. There has been discussion on the MFI board as to whether the system relies on a few really big winners, or whether most stocks move towards large gains. My results so far have 3 winners above 20%, 2 more 9% or greater, several that are within 5% of even, and one big loser. This is only after 4 months, which means that this is statistically meaningless, and also that anything can still happen. Finally, half of my most recent six HG picks are in the teens of returns, and half of my first set of picks are absolutely kicking butt. WLT is at 6%, and the others are nearly flat. Pretty darn good for the first four months.
There is one major caveat that I need to keep in mind. Of everything that I bought, I was really excited about ASPV. And that has proven to be the biggest loser so far. So I'm not a good stock picker: I'm lucky. From everything I've read, the longer I can keep that in mind, the better I'll do in the long run. So from now on, every time that I pick any basket of stocks, I'm going to predict which ones will do the best. I expect that these rankings will not at all correlate with actual performance, but will instead serve to keep me humble.
Finally, I want to talk about ASPV. This one is a whopper. First, it announced that it would miss analyst estimates for the quarter. It reiterated that for the year it would make 163% of last year's earnings. But still, it dropped 10%. I thought that was way less bad than the market thought. And then they announced that their drug didn't pass phase III trials for another indication, and the stock dropped another 11%. At this new price, the PE is ~6.5 TTM, with a forward PE of ~5.3. All of this together got me thinking. The CellCept patent runs out in 2009. So shareholders can count on about 2-3 more years of great earnings, and then the well dries up. Unless, that is, the company finds either another drug or another indication for their drug. It's a bit of a desperation situation. Another way of looking at this is: the PE is the number of years it takes for the current earnings per share to pay back the investment. From this perspective, investors at this point are betting 2.3 years worth of earnings that the company will find some way to remain profitable beyond the patent protection of CellCept. If they do find some way to remain profitable, the PE should shoot up to some amount beyond the patent protection or other limit of the new drug in question. The years worth of betting on management amount to 43% of the PE. Cash per share, after subtracting the miniscule amount of debt, is $5.50. So of the remaining cost of the share, is 43%, or ~$5.60, represents the bet that management will find a new drug, or a new indication for their drug, within the next few years.
Finally, I want to talk about ASPV. This one is a whopper. First, it announced that it would miss analyst estimates for the quarter. It reiterated that for the year it would make 163% of last year's earnings. But still, it dropped 10%. I thought that was way less bad than the market thought. And then they announced that their drug didn't pass phase III trials for another indication, and the stock dropped another 11%. At this new price, the PE is ~6.5 TTM, with a forward PE of ~5.3. All of this together got me thinking. The CellCept patent runs out in 2009. So shareholders can count on about 2-3 more years of great earnings, and then the well dries up. Unless, that is, the company finds either another drug or another indication for their drug. It's a bit of a desperation situation. Another way of looking at this is: the PE is the number of years it takes for the current earnings per share to pay back the investment. From this perspective, investors at this point are betting 2.3 years worth of earnings that the company will find some way
 to remain profitable beyond the patent protection of CellCept. If they do find some way to remain profitable, the PE should shoot up to some amount beyond the patent protection or other limit of the new drug in question. The years worth of betting on management amount to 43% of the PE. Cash per share, after subtracting the miniscule amount of debt, is $5.50. So of the remaining cost of the share, is 43%, or ~$5.60, represents the bet that management will find a new drug, or a new indication for their drug, within the next few years.
Monday, October 23, 2006
Cubist's Earnings and the Market's Expectations
Clearly, I am still learning how the market 'thinks' - how it reacts to news.
Cubist announced the other day that it had its first profitable quarter ever. But it was under analyst estimates of revenue (~$50M vs. ~$54M). So it lost 6% in afterhours trading immediately following the announcement. Whatever the analysts' estimates, though, this is still a 58% increase over Q3 last year! I would have thought that would be enough for shareholders, but apparently not. Non-GAAP income was $0.14 per share, while GAAP income was $0.09 per share, compared with a loss last year of $0.08 per share. Isn't this a good thing? After a morning low of $21.21 the day after the announcement, the market decided this was all good news, and shares peaked at $23.18. That's a 9.2% total change from valley to peak! Just because of the market being indicisive!
In The Intelligent Investor Today, Larry Swedroe makes the point a few times that the market prices in expectation. So a downturn after missed earnings is something that I can almost understand... Except that analyst pricing is notoriously inaccurate. I'd think that investors would take them as rough guestimates rather than as precise numbers. In fact, analysts have a tough time getting the direction right, let alone a specific number by a specific date. (Swedroe talks more about macroeconomic analysts, who try to estimate general market trends; probably analysts do better on specific stocks with defined products and markets.) Givn all of this, wouldn't something close to analyst expectations be at least neutral if not positive? More importantly, shouldn't the milestone of the first profitable quarter help a company rather than hurt it? Obviously, I wasn't the only one expecting good news this quarter. But was that good news priced into the stock? I don't believe that there's an answer, because the stock yo-yo'd and ended up maybe a percent or two. From the close of business prior to the earnings announcement to the close today, CBST is up 3.5%. This may be nothing but noise: The NASDAQ is up 0.76% in the same period. Is this a significant difference? Maybe it is, now that I see the numbers. But the beta for CBST is ~3, so maybe this is just chance and nothing more. In other words, are we looking at an efficient market or a foolish Mr. Market? I still don't know.
Subscribe to:
Posts (Atom)