- I don't know how random the generator was: in a sample of 180-odd stocks, there were five repeats. This seems high considering the sample size relative to the total universe of stocks.
- Piotroski F-Scores were found using an Excel Add-In; in some cases it returned an error. So the actual sample sizes were: $1M - 78; $2B - 92; Random - 94.
- The $1M portfolio simply includes the top 100 stocks in the current MFI screen, with the range of market caps from $15M (ANTP) to $14B (NUE), with a median value of $439M.
- The $2B porfolio has a range of market caps from $2.013B (HNI) to $384B (XOM - Exxon Mobil), with a median value of $5.59B.
- The randomly-generated portfolio had a range of market caps from $7.4M (VERT) to $60.8B (QCOM - Qualcomm), with a median of $187M.
- What is the statistical significance of this experiment? In order to be truly confident in these results, in other words, to be sure that the different distributions are not soley due to chance, this experiment should repeated some large number of times, say 1000. I think that a t-test might be valid, but I also think that there might be a problem because the MFI portfolios have a skewed (rather than perfectly normal) distribution. In case they are valid, I'll just mention that the P-vaues for the $1M and $2B portfolios, as compared to the random portfolio, are 0.0005 and 5e-12, respectively.
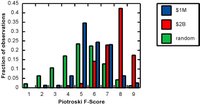
Click on the figure to expand it. The group of random stocks is pretty  much normally distributed, while the $1M and $2B MFI stocks are right shifted. There were no stocks in the $1M portfolio with a F-Score less than 2, and none in the $2B portfolio with a F-Score less than 3. The $2B portfolio is skewed towards higher F-Scores.
It makes sense that no MFI stock has a 0 or a 1 F-Score: MFI stocks have a high earnings yield and return on invested capital, which should be closely related to accrual (or maybe CFO) and ROA. But, it is surprising that the large cap portfolio is the one that is further right-shifted than the total MFI portfolio. Both Piotroski and Greenblatt concluded from their analyses that small cap stocks are better performers when selected by their respective methods. So why does a broader portfolio score worse than a focused, high market cap portfolio? What's the difference between Piotroski and MFI? I think that the difference is important, actually. MFI uses two characteristics, but the ranking system lets the screen scale the potential performance of the stocks. In other words, the one stock with a F-Score of 2 probably scored really highly on those two characteristics - but the F-Score fails to take that into account because it is based on binary analysis for all of its characteristics. Is there some way to combine the two approaches? Sure. For every stock, rank it for each Piotroski characteristic. Combine the rankings for an ordered list, like in MFI.
Is this necessary? Maybe not. Greenblatt argues that EY and ROIC are the major determinants of performance. And I think that MFI and Piotroski analyses are supposed to give comparable returns - possibly even MFI is superior, I think. So is Piotroski diluting the effects of the MFI characteristics by including the 7 other characteristics? What are the relative effects of each Piotroski characteristic? Rerun the Piotroski analysis 9 times, but for each rerun, make one of the characteristics worth 3 instead of 1. If this results in superior outcomes in terms of portfolio change, then you've identified a more important characteristic. This can be confirmed by systematically dropping one characteristic from the Piotroski F-Score, and looking for an increased drop in portfolio returns relative to dropping any of the other characteristics.
Finally, how does this affect my stock buying strategy? I'm not sure so far, because I'm not sure that I want to mess with something that's working. My current MFI strategy is:
- Pick stocks from the top-100 stocks with a minimum market cap of $1M.
- Buy 5 stocks every 2 months.
- Prefer stocks with recent insider purchases.
- Prefer stocks that have high insider ownership.
I'm considering adding the following rules:
- Only buy stocks with a high Piotroski F-Score.
- Only buy stocks with low or no analyst coverage. I rather like this one, as it typically means that Mr. Market has a worse idea of how to value any given stock.
I suspect that few stocks will meet all of these rules. This might involve checking the MFI top 100 more often than every 2 months and buying whenever I find a stock that does meet all of these criteria.
3 comments:
Wow,
Big departure from your earlier blogs.
A lot more science and background.
I'll have to get you to dumb it down to my level.
*grin*
See you this week!
Is there a Piotroski Score Generator tool out there anywhere that allows to to simply enter a ticker symbol and see what the score is? Thanks
[B]NZBsRus.com[/B]
Dont Bother With Laggin Downloads Using NZB Files You Can Hastily Search HD Movies, Games, MP3 Singles, Applications & Download Them @ Dashing Rates
[URL=http://www.nzbsrus.com][B]Newsgroup[/B][/URL]
Post a Comment