VPHM - 57%
TRLG - 27%
BLD - 12%
ISNS - 20%
DECK - 150%
The weighted average return is 55%
Dow Jones - 20%
S&P 500 - 18%
Russell 2000 - 15%
Aiming for exceptional returns
cks. The experiment is pretty simple: collect the close price of both options and underlying stocks at some time (in this case, Jan. 6, 2007) at some later date. In this second experiment, I collected pricing information for some 38 stocks and options (38 was the number of MFI stocks in the top 100 stocks over $1M that had options available for either April or May). For each option, I chose a strike price that was as high as possible but still in the money. Just before the expiration I recorded the change in option price, as well as that of the underlying security. It's pretty clear that the option price amplifies the change in underlying stock price (Fig. 1). The change in stock price was 16.7%, with a standard deviation of 18.5%; the median change in stock price was 14%. By comparison, the change in option price was 59.7% on average, with a standard deviation of 105.7% and a median change of 40.9%.
out a Monte Carlo simulation (a very simple one) in which I randomly drew 5 options from the group of 38, 44 times. The mean return of these 44 portfolios is 64.4%, with a standard deviation of 46.9%. The median return was 65.7%. The distribution of returns is skewed towards the higher end of the range (Fig. 2). How good was the randomization of my Monte Carlo simulation? Just to be clear, I took a look at the number of times each option was selected in the 44 portfolios (Fig. 3). It's not bad, but could maybe be better. But the real point is, purchasing options definitely seems to amplify the returns of underlying securities. This needs to be qualified in that the general market has been going up over this time period. I don't know whether thse results have anything to do with the fact that these are MFI stocks, only that this group of stocks went up over the course of four months, and the options went up be even more. In principle, MFI stocks should on average ou
tperform the market, but by exactly how much is not clear. In particular, the options in this study (and my previous one) were held for either four or five months. For four month holding periods, a 16% average return is clearly quite good. Also, although I was not pleased about this with regards to my real-life portfolios, for the sake of the study it was reassuring that the slump that came about late February from the drop in the Shanghai market was barely a hiccup for the returns of this portfolio.
options grouped by the change in value of the underlying security (Fig. 4). Clearly the sample size for these groups is pretty limited, but it's a start. Basically, it seems that with less than a 5% increase in stock price, the option price drops. This represents at least in part the cost of the time premium. Above a 10% change in stock value, and it seems like a pretty good chance that the option is going to be profitable. So, this leads to the question, what is the chance of at least a 10% increase in stock price within four months?
the IRR for the Dow is 16.4%; that of the S&P is 18.2%; the Wilshire 5000 had an IRR of 18.7%; and the Russel 2000 returned 17.2%. So things are going well.
DECK has always been doing well, while WNR is a recent addition to my top-movers. VPHM was once my first double, but now has pulled back to the number three slot. FCX was well under the price I paid for it for a while, but has now clawed its way back to positive territory. UEPS seems to keep fighting with that $30 upper limit. It keeps making it there, and then falling back to just a little more than I bought it for.
Some of this effect is due to the fact that some purchases are more recent than others; however, this is not all of the effect, because both portfolios include stocks that are recent purchases as well as stocks that are older. In Marshall's study of monthly MFI portfolios, he found that they beat the Russell 3ooo most months. I wonder what the distributions of returns were within each portfolio? Is it the case that each portfolio has a small number of big winners with the majority of stocks giving moderate returns? This may be worth further study...
This seems somewhat low to me. Not that I've got some great insight into what that should have sold for... but it just seems low. And not just to me. A January article over at the Motley Fool predicted that they'd find a distributor, and that it would get them $10-$20M upfront. A big difference! A little good news, MEDX started another phase I trial with MedImmune. This had absolutely no effect on the share price, though. On the other hand, ARNA started a phase II trial, and the stock price dropped ~5%. ARNA and NOVC are also up for reconsideration. But I also want to consider this carefully. The idea with the biotech portfolio was that my understanding of the science would allow me to judge the science, not just base decisions on announcements like these. So, this is something that I'm still working on. Because it's also been an important lesson that the science is just a small part of the whole package with biotech companies.
that I didn't think of this before.) One thing that is becomes clear, especially when you compare the WIRE data with that of other companies (see figure) is that what you actually want in this analysis is an exponential increase, not a linear increase. An exponential increase in EBIT means that the company is efficiently using its resources to efficiently generate a return on capital. Conversely, a linear increase means that the company is doing less business with more cash on hand. I'm not 100% sure that this logic is correct, but I'm basing it off of the Buffett principle that % return is what's important rather than earnings.I expect that these ideas will help me a lot in thinking through businesses that I am considering investing in. My strengths are understanding probabilities of companies succeeding based on various strictly financial characteristics (PE, EY, ROIC, etc.). It is more difficult for me to think through the business aspects, and I think that these tenets will help to focus my thinking.
1. Understand how the company makes money. I remember reading somewhere that Ray Kroc insisted on owning the property of all McDonald's restaurants. He was in real estate, not in the restaurant business. I have the benefit (the 'One Up' advantage) of understanding biotech. (My most recent thinking about this, though may mean that it's a benefit that encourages me to be extremely selective. I'll probably write more about the problems that are specific to biotech at some point.)
2. What's the operating history? What does the future hold? The company doesn't have to always have been successful in every type of market, but perhaps the lows should be not so low - or should be the entry point. For the future, the best type of business to own is a franchise. The kind of company that can raise prices to keep up with inflation, for which there is no substitute, which sells something that is desired or needed, and whose profits are not regulated. In other words, it needs a moat. Most companies are somewhere in between, either a strong commodity, or a weak franchise.
Phil Town in Rule #1 describes five kinds of moats: Brand, Secret, Toll, Switching and Price. A brand is trusted or recognized, a secret involves patents or trade secrets. There is a toll when a company has exclusive control of the market (monopoly), switching is when there is a high barrier to changing providers, and price is when a company can price competitors out of the market. I suspect that price is the weakest moat: a new challenger may have a difficulty competing, but anyone who does automatically drives margins lower. In fact, Buffett prefers to avoid commodities, and a moat built solely on price essentially commoditizes what is being sold. (I think.)
3. Is management rational? Watch how management reinvests cash: does it earn more than you could earn elsewhere? Cash should either earn a high return or be returned to shareholders as a dividend or through share buybacks. Is management cadid? How do they discuss failures and problems? Listen to the conference calls for this. Do they avoid the institutional imperative? Will they take solutions to problems that cause short-term loss of profitability in exchange for long-term solutions and profitability?
4. ROE is more important that EPS, because increases in EPS don't take into account the company's (hopefully) growing cash base.
5. Calculate "owner earnings," which is Net Income + Depreciation/Depletion + Amortization - Capital Expenditures. Use this to determine the value of the business: Estimate the future cash flows of the business. How? Do the owner earnings show a consistent rate of growth? Use that rate. Then discount that rate by the rate of bonds. This gives the current value of the company. I'm not sure that I've completely grasped this; it's something to come back to. In particular, I know that Motley Fool is a proponent of free cash flow and owners' earnings, so I'll look into it there.
6. High profit margins are a sign of a strong business and of management that controls costs. Look at the margin over the years. I suspect that looking at the SG&A over time will also be informative.
7. Make sure that the company creates more than a dollar of market value for every dollar retained. It's apparently a simple calculation: Determine the retained earnings by subtracting the dividends paid from the net income. Sum the retained earnings over the last ten years. Compare this value to the change in market value over the last ten years. If more market value has been created than earnings retained, then the market has valued the company more highly than its earnings.
8. Insist on a margin of safety. Buffett insists on 25%. Phil Town stresses 50%. The difference between these is that Phil Town knows that he's teaching beginners who have a higher probability of having made a mistake somewhere along the way; Buffett has a better chance of correctly valuing a company that someone following Rule #1.
It is one of my major goals for the year to carry out more thorough analyses of purchases. I'm going to be looking for moats and good management more than anything else (MFI automatically finds companies selling cheaply relative to most recent earnings, although more complicated analyses could almost certainly refine the margin of safety.) I also like the idea of ensuring that the company creates more than a dollar of value per dollar retained.
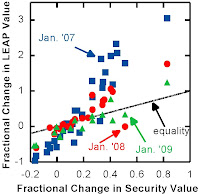
stock, I recorded the close price, as well as the close price of Jan. '07, '08 and '09 LEAPs with a strike price just below the close price of the security. Now, 4 months later, using the close as of December 8, I have determined the change in security and derivative values. LEAP values that expire in Jan. '08 and '09 changed in close accordance with stock price. (Click on the figure, and all figures, to expand them.) As the Jan. '07 expiry date approached, the LEAPs changed in price, in many cases dramatically. Of the 32 stocks that had options expiring in Jan. '07, the mean ± SD was 0.51 ± 1.05. This is a huge gain in that period of time, but much greater variability. The median change in value was 12%.
by more than 10%? Figure 2 shows the distribution of LEAP by amount gained, as well as the gain for each category of LEAP. I think it is valid to then calculate an expected return: multiply the fraction in each category by the return of the category for an expected return in each category. By summing the expected returns of each category, you get the overall expected return, which is 17%.
of the 50 portfolios resulted in a loss, averaging -11% ± 6.5%. By comparison, 11 of the 50 porfolios ended up more than doubling, with average returns of 115% ± 17%.
have a better idea whether using LEAPs of MFI stocks improve returns. But, this data suggests that there may be an advantage to buying LEAPs of MFI stocks as compared to the stocks themselves.
sort of short cut to #2, but only partly. So, in keeping with my previous analysis of MFI stocks, here's an analysis of the top 100 stocks with a market cap of at least $1M. (Actually, because of errors acquiring the F-Scores of a nuber of stocks, the actual sample size was 77.) It's a skewed distribution, weighted towards stocks with 'good' company characteristics, as defined by the F-Score. If you compare this distribution to that of my last analysis, there is a remarkable similarity (comparing to the distribution of companies with a market cap of at least $1M). Also, companies with higher F-Scores had larger market caps.